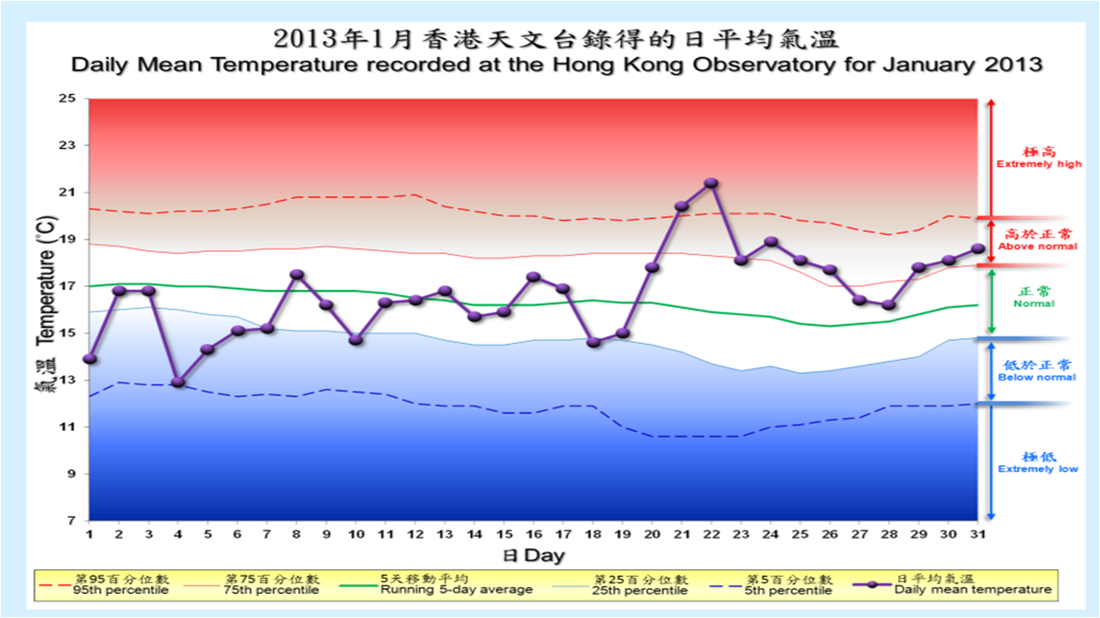
Mean
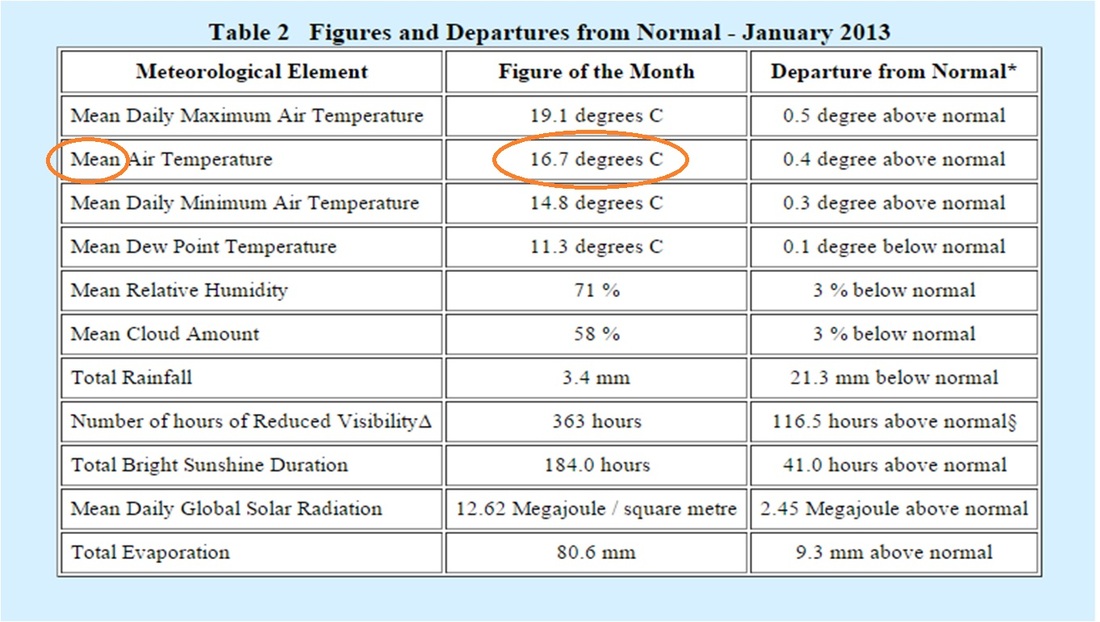
The chart above chose to use mean to describe the temperature of the all month. The reason to use mean is that it involves all data (charts below) including the high and the low. So we regard this mean temperature as a normal degree for future reference. Median doesn’t relate to every day’s temperature. If we use median instead, it may come out a similar figure. But we will be a little one-side in this situation.
Median
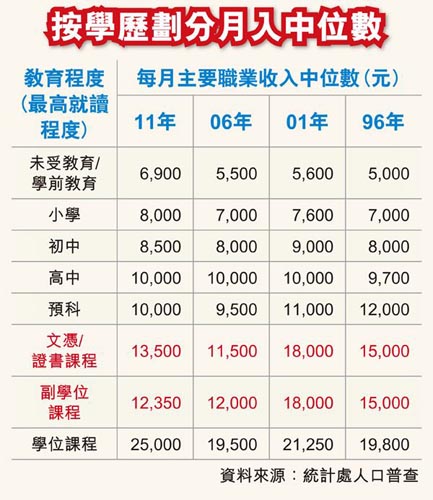
This chart above used median to describe the changes of salary of different classes. As we all know, there are always few people who get extremely high salary and few people whose wages are at a low level. Mean will not be useful at this circumstance because it will include those few but special figures which could influence the result vastly. Median is chosen because it avoids the extreme numbers and tells the general tendency.
 RSS Feed